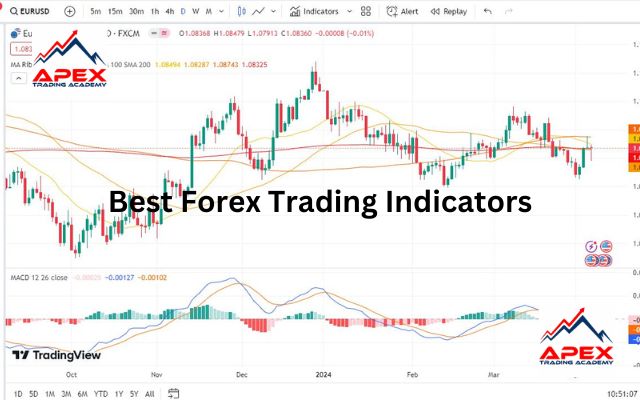
In forex trading, success hinges on informed decisions backed by comprehensive analysis. One key aspect of this analysis is the use of forex trading indicators. These indicators offer valuable insights into market dynamics, trend directions, volatility, and potential entry and exit points.
Whether you’re a beginner or an experienced trader, understanding and utilizing these indicators can significantly enhance your trading strategies.
In this trading lesson, we aim to provide you with the 11 best forex trading indicators that every trader should know and include in their trading arsenal.
As a beginner trader, you could ask “what are forex trading Indicators?”
What is a Forex Indicator?
Forex indicators are essential tools used by traders to analyze market data and make informed trading decisions. These indicators are mathematical calculations plotted on price charts, providing valuable insights into market trends, volatility, momentum, and potential reversals. By interpreting these indicators, traders can identify trading opportunities and manage risk effectively.
The Top 11 Forex Trading Indicators That Every Trader Should Know
-
Moving Average (MA)
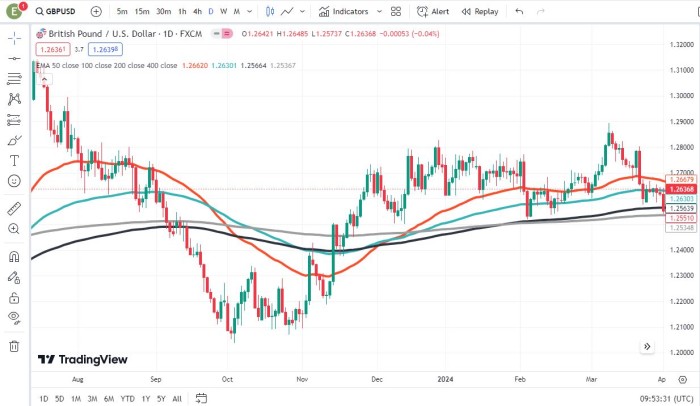
Moving Average (MA) is a fundamental forex indicator that calculates the average price of a currency pair over a specified period. It helps traders identify the direction of the trend and potential entry/exit points. When the price is above the MA, it indicates an uptrend, while a price below the MA suggests a downtrend.
-
Bollinger Bands
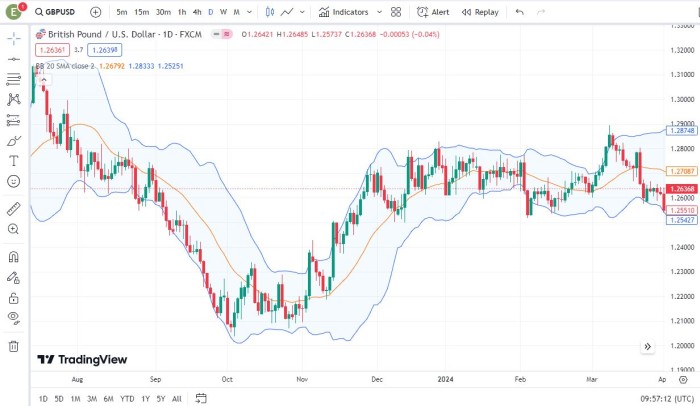
Bollinger Bands are volatility indicators that consist of three bands plotted around the price chart. These bands dynamically adjust based on market volatility, providing valuable insights into overbought and oversold conditions. Traders use Bollinger Bands to identify potential breakout and mean reversion opportunities.
-
Average True Range (ATR)
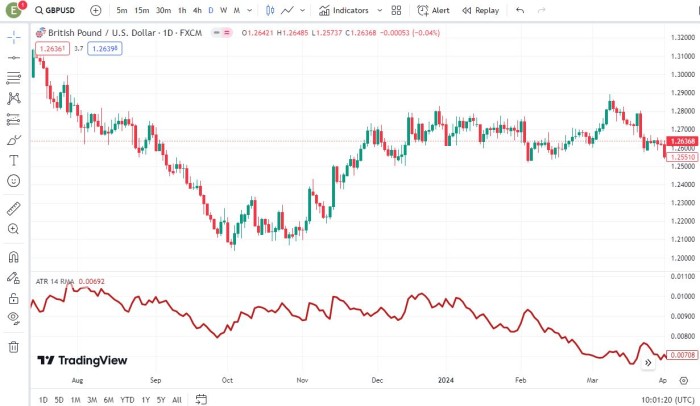
Average True Range (ATR) measures market volatility by calculating the average range between high and low prices over a specific period. It helps traders adjust their position sizes and set appropriate stop-loss levels based on current market conditions.
-
Moving Average Convergence/Divergence (MACD)
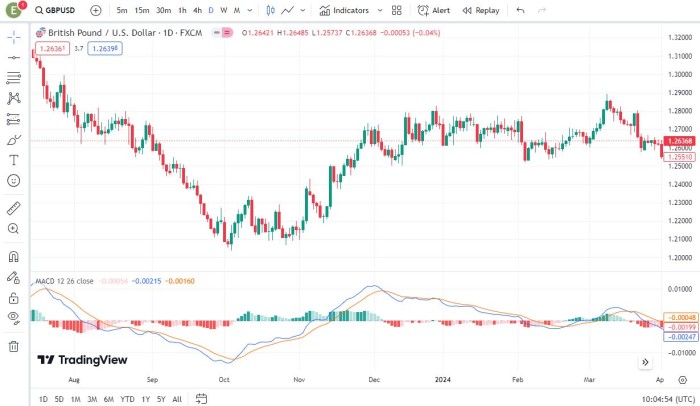
MACD is a momentum indicator that detects changes in trend strength and potential reversals. It consists of two moving averages and a histogram, providing valuable signals when the moving averages converge or diverge.
-
Fibonacci
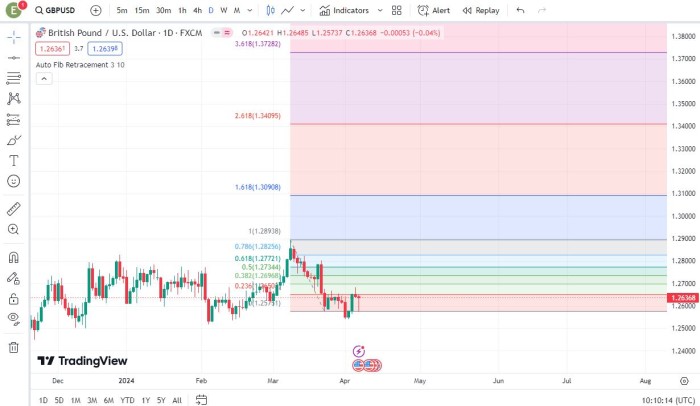
Fibonacci retracement levels are based on the mathematical sequence that identifies potential support and resistance levels in the market. Traders use Fibonacci retracements to identify areas of price retracement within a larger trend.
-
Relative Strength Index (RSI)
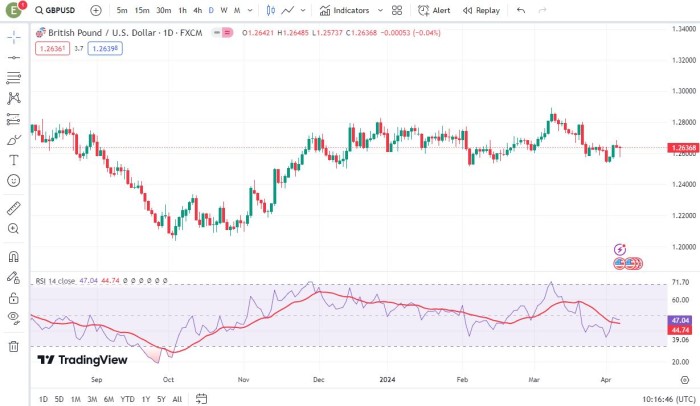
RSI is an oscillator indicator that measures the speed and change of price movements. It helps traders identify overbought and oversold conditions in the market, signaling potential trend reversals.
-
Pivot Point
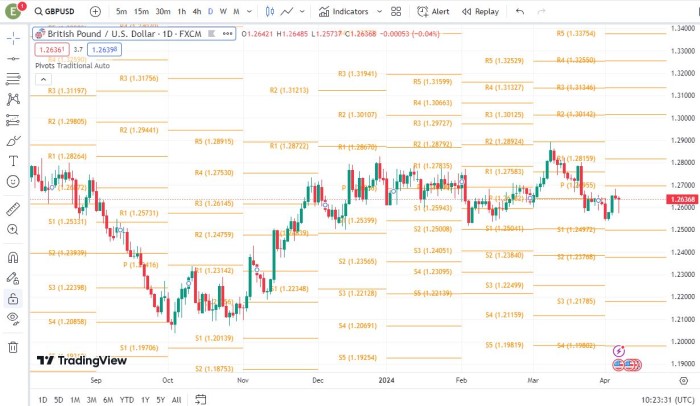
Pivot Point is a support and resistance indicator that helps traders identify key levels where price trends may reverse. It consists of central pivot points and support/resistance levels calculated based on previous price data.
-
Stochastic Oscillator
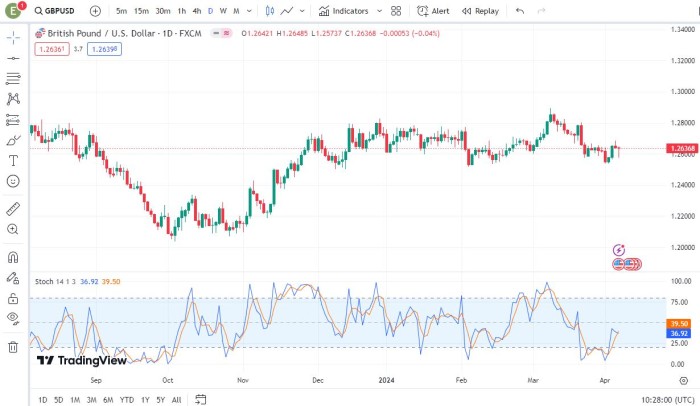
Stochastic oscillator is a momentum indicator that helps traders identify potential trend reversals and overbought/oversold conditions. It compares the closing price to the price range over a specific period, providing valuable insights into market momentum.
-
Donchian Channels
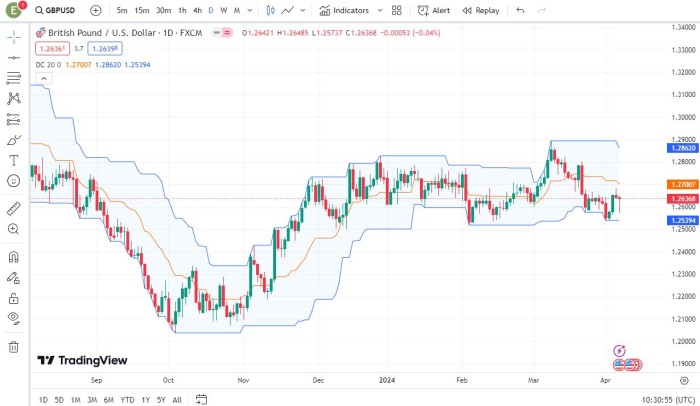
Donchian Channels are volatility indicators that plot upper and lower bands based on the highest high and lowest low prices over a specific period. Traders use Donchian Channels to identify potential breakout and trend continuation opportunities.
-
Parabolic SAR
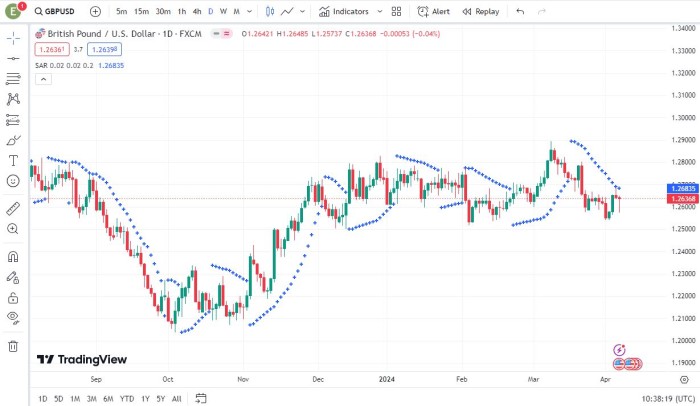
Parabolic SAR (Stop and Reverse) is a trend-following indicator that provides potential entry and exit points based on market trends. It consists of dots plotted above or below price candles, signaling potential trend reversals.
-
Ichimoku Cloud
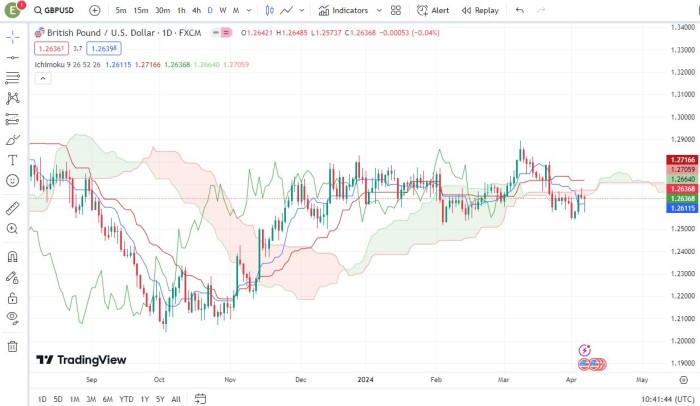
Ichimoku Cloud or Ichimoku Kinko Hyo is a comprehensive indicator that provides insights into trend direction, support/resistance levels, and momentum. It consists of multiple components, including the Conversion Line, Base Line, Leading Span A, Leading Span B, and Lagging Span. It offers a holistic view of market conditions.
How to Trade Using Forex Indicators
-
Identify the trend direction using MA or MACD
Moving Averages (MA) provide a clear indication of the prevailing trend direction. For instance, if the price is consistently above the MA line, it suggests an uptrend, while a price below the MA line indicates a downtrend. Similarly, MACD helps identify changes in momentum, indicating potential trend reversals.
-
Use Bollinger Bands to identify potential entry/exit points based on volatility
Bollinger Bands are effective in gauging market volatility. When the bands widen, it signifies increased volatility, and when they narrow, it indicates decreased volatility. Traders can use Bollinger Bands to identify potential entry points when the price touches the lower band in an uptrend or the upper band in a downtrend.
-
Determine market sentiment using RSI or Stochastic
Relative Strength Index (RSI) and Stochastic are oscillators that measure overbought and oversold conditions in the market. Traders can use RSI values above 70 to identify overbought conditions and consider selling, while values below 30 suggest oversold conditions, indicating a potential buying opportunity.
-
Confirm trend reversals with Fibonacci retracement levels or Pivot Points
Fibonacci retracement levels help traders identify potential reversal points in a trend after a significant price movement. Pivot Points, on the other hand, indicate levels of support and resistance based on previous price action. Traders can look for confluence between these levels and other indicators to confirm trend reversals.
-
Use Donchian Channels or Parabolic SAR for trend-following strategies
Donchian Channels highlight the highest high and lowest low over a specified period, helping traders identify the strength and direction of the trend. Parabolic SAR provides stop and reverse points, assisting traders in trailing their stop loss orders and staying in trending markets for longer.
-
Analyze overall market conditions with Ichimoku Cloud
Ichimoku Cloud offers a comprehensive view of market conditions, including trend direction, support and resistance levels, and momentum. Traders can assess the cloud’s thickness and the position of the price relative to the cloud to determine the strength of the trend and potential entry points.
Tips for Using Indicators Effectively
- Avoid using too many indicators to prevent analysis paralysis: Using a multitude of indicators can lead to confusion and indecision. It’s essential to focus on a few key indicators that align with your trading strategy and provide meaningful insights. By keeping your analysis simple and concise, you can make clearer trading decisions.
- Customize indicator parameters based on current market conditions: Market conditions are dynamic, and what works in one situation may not work in another. Adjusting indicator parameters, such as period lengths or smoothing factors, can help adapt to changing volatility or trend strength. By optimizing indicator settings, traders can better align their strategies with prevailing market conditions.
- Use indicators to confirm your analysis rather than relying solely on them: While indicators provide valuable insights, they should complement, not replace, thorough analysis. It’s essential to incorporate other factors such as price action, support and resistance levels, and fundamental analysis into your decision-making process. Indicators serve as confirmation tools to validate your trading thesis.
- Correlate indicator signals with price action context for better decision-making: Context is key when interpreting indicator signals. Consider the broader market environment, recent price movements, and chart patterns when assessing indicator readings. By correlating indicator signals with price action context, traders can gain a deeper understanding of market dynamics and make more informed trading decisions.
- Track the performance of your indicators over time to optimize your trading strategies: Regularly evaluate the effectiveness of your chosen indicators by monitoring their performance over time. Keep detailed records of trades, including entry and exit points based on indicator signals. By analyzing historical data, traders can identify patterns, strengths, and weaknesses in their strategies, allowing for continuous improvement.
What’s the Most Accurate Forex Indicator?
The most accurate forex indicator is the Ichimoku Kinko Hyo as we have a 65% winning rate with it over the last 5 years at Apex Traders Academy.
However, pinpointing the most accurate forex indicator is subjective and depends on individual trading styles and preferences. Each indicator serves a specific purpose and may perform differently in various market conditions.
Disclaimer: This result is based on our 10 years trading experience and not typical. Result may be different based on your trading skill sets and level of experience.
Which Indicator is the Most Profitable?
Ichimoku Kinko Hyo is the most profitable forex indicator, because it is the most accurate indicator. It returned approximately 6% yearly over the last 5 years at Apex Traders Academy.
However, there’s no one-size-fits-all answer to this question as profitability depends on various factors, including market conditions, trading strategy, and risk management. Traders should focus on understanding the strengths and limitations of each indicator and how they align with their trading objectives.
Disclaimer: This result is based on our 10 years trading experience and not typical. Result may be different based on your trading skill sets and level of experience
Our Final Thoughts and Recap
Incorporating the right forex trading indicators into your strategy can significantly enhance your trading performance and decision-making process. By understanding the functionalities and applications of these indicators, traders can navigate the complex forex market with confidence and precision. Whether you’re a beginner or an experienced trader, mastering these 11 best forex indicators will aid you in your trading.